


CDPHE's Enviroscreen, a vocab lesson on efficiency vs. intensity, an update to the bill to kill oil and gas in CO.
What is CDPHE's Enviroscreen and why does it matter?
I got some material from a reader that I wanted to share because it gives me an opportunity to educate us all (I include myself here) on things that may not make news NOW, but can have an impact in the future.
The material relates to CDPHE's Enviroscreen. I put a link to the "landing" page first in the list below.
The idea behind Enviroscreen is intimately involved with a concept called environmental justice. If you've not heard the term before, environmental justice is (according to the EPA--source page linked second below)) " ... the fair treatment and meaningful involvement of all people regardless of race, color, national origin, or income, with respect to the development, implementation, and enforcement of environmental laws, regulations, and policies." It is achieved, again quoting, "...when everyone enjoys: the same degree of protection from environmental and health hazards, and equal access to the decision-making process to have a healthy environment in which to live, learn, and work."
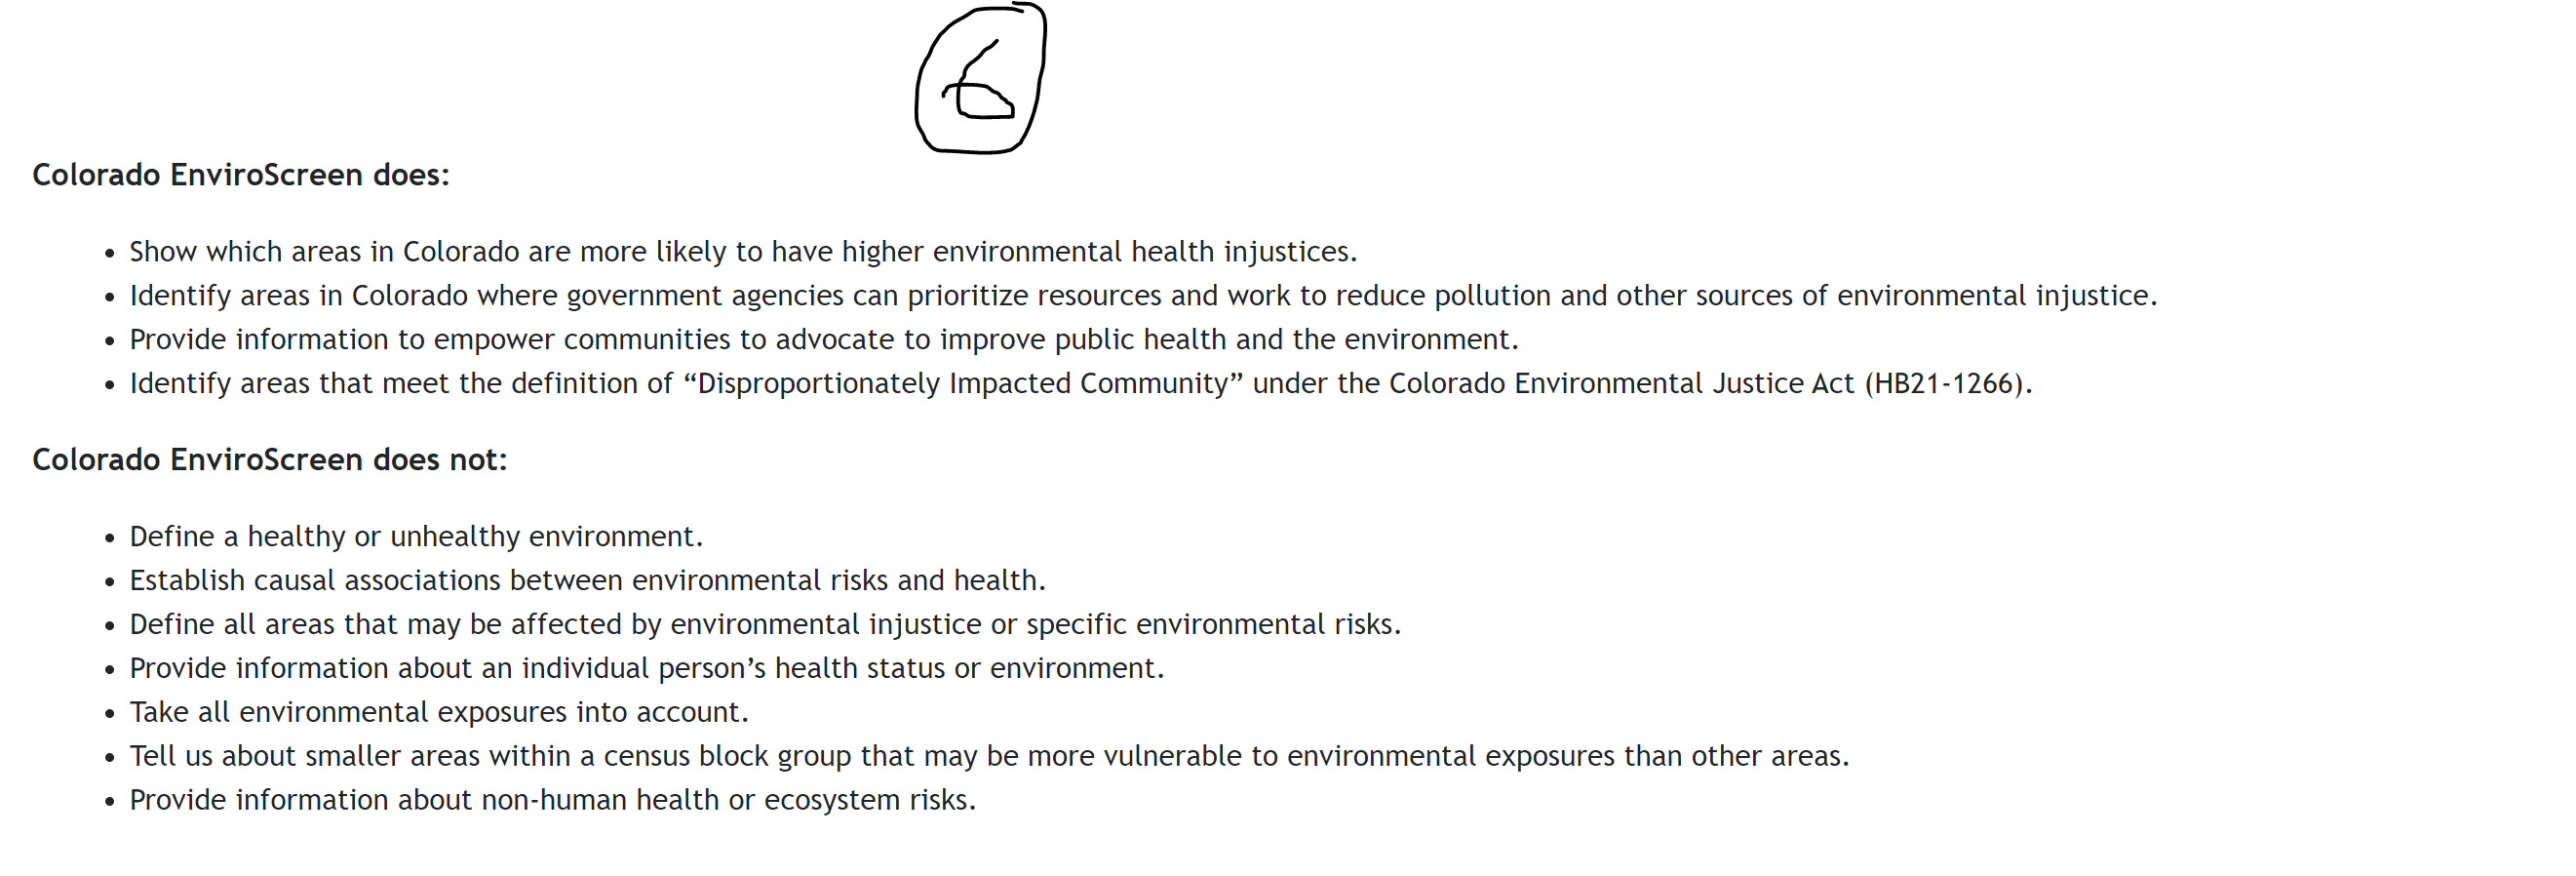
Back to what Enviroscreen is. I'll leave it to you to poke around in the FAQ's section of the site, but the upshot is that Enviroscreen is a map/data tool that you can go into to see how much of a "burden" different communities face. You can see this as tables or graphs or maps. For example, if you look at screenshot 1 you'll see a map of the state with the overall "burden" each region bears shown by the intensity of the purple color (deeper color = more burden). On this map it's plain to see Pueblo has a high burden while Pitkin has almost none on this scale.

The burdens are given as percentiles. My county (Logan) has an Enviroscreen score of 70, meaning Logan county has a score that is higher than 70% of all the other counties in Colorado.
You can also see, for a select few areas, "Story Maps" which combine narrative and some estimates/data of things like greenhouse gas emissions or the location of Superfund sites.
How is the score Enviroscreen, the number that gives an idea of how burdened a region is, determined? Screenshot 2 gives an overview of the different categories that "flow" into the definition, and some example ways that CDPHE defines things for these different categories is in screenshot 3. The other categories and definitions can be found on the site linked first below.


Why was this created? Enviroscreen was created in response to a 2021 Assembly session bill (linked third below) and is proported to help define a "disproportionately impacted community" so that they can (quoting the Enviroscreen site linked first below):
"...directly benefit from:
--Money and other resources. For example, CDPHE’s Environmental Justice Advisory Board will use EnviroScreen to determine where to distribute environmental justice grants created by the new law.
--Enhanced opportunities to participate in Air Quality Control Commission rulemaking and permitting decisions.
--Priority for enforcement and compliance initiatives under an agreement between CDPHE and the U.S. Environmental Protection Agency."
Okay, so now that we've had a quick tour, let's depart from the how's and why's to talk about meaning. Just a reminder: we're now getting into more of my opinion and opinions vary. It is reasonable to see things differently than I see them below.
It is tempting when you see entire websites built and percentiles quoted and flow charts displayed to stand in awe of things and believe that they are the God's honest and sole word. Avoid that temptation. EnviroScreen (or other, similar things) is someone's opinion of how to rank something. Different people rank things differently, and no ranking made by humans has been carved into stone tablets by lightning bolts.
For example, take a look at screenshot 4. The decisions were made by CDPHE and CSU professionals, but also guided by input solicited from the public. If you watch enough things like this you'll soon see that the input received (unless it is taken from a random sample of people) is often from environmental advocates. Further, you'll see that oil, gas, and mining were heavily weighted to the exclusion of other industries. EnviroScreen is not randomly generated by disinterested individuals.

Additionally, staying with screenshot 4, you'll note that they saw fit to include some industries and not others. They gave us the rationale in this case, but did they for all the decisions they made? They had to put boundaries somewhere on their rankings.
In a similar spirit, I reached out to the email listed on EnviroScreen's page to ask whether or not they included the noise and "shadow flash" from wind turbines among their environmental burdens. The email I got back is in screenshot 5.

Lastly, I want to talk about the problems with the data that the folks from CDPHE and CSU used to calculate the burdens. These are not made up by me either. What I share in the screenshots is from EnviroScreen's own site. See screenshots 6 and 7.
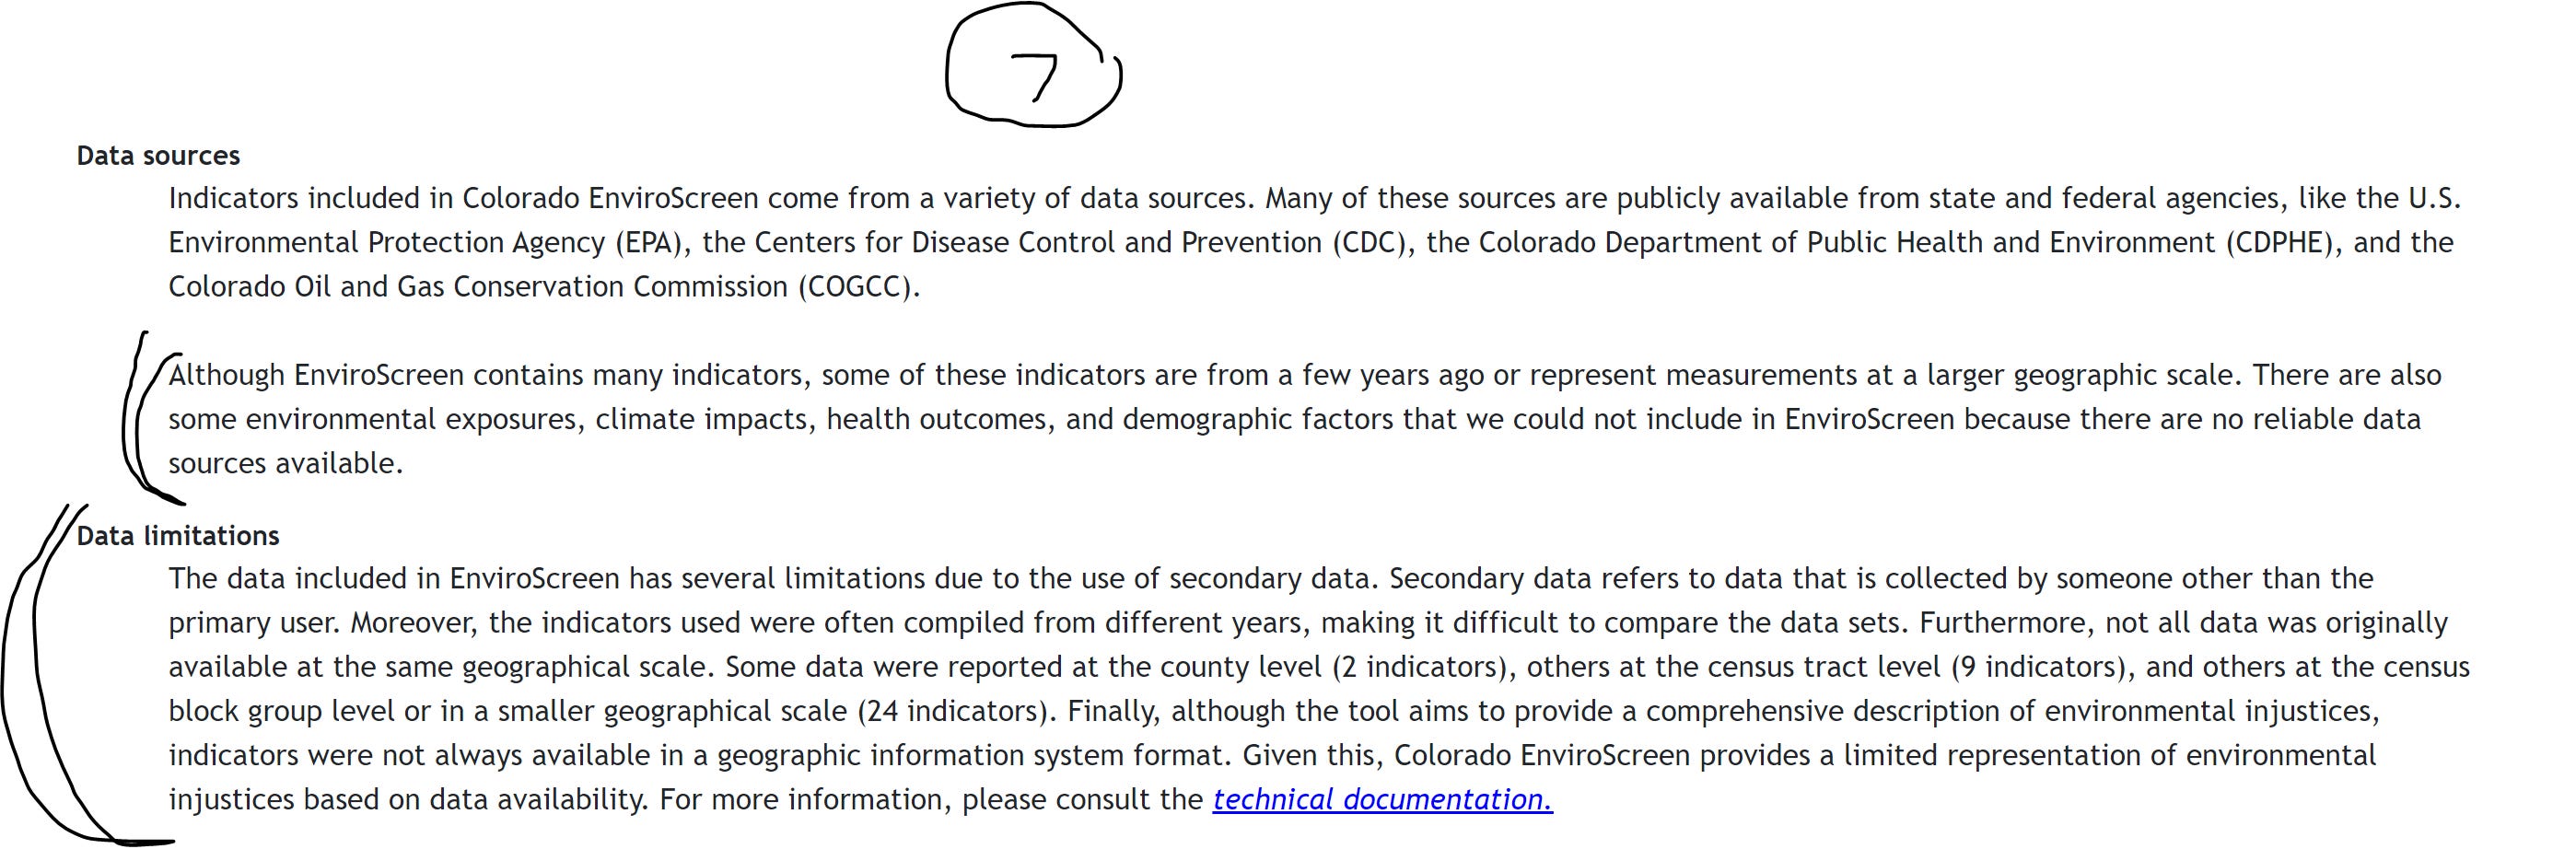
Why is this a big enough concern to warrant this much typing? My concerns here are not about the methods used to build EnviroScreen per se. There are legitimate concerns, of course, but I don't think enough to say that the whole effort has no meaning. My concerns center around the fact that flawed data will not be recognized as flawed and that this data will get used (despite the warnings and caveats--see screenshot 6, lower half) to drive policy.
I'll hear it quoted in testimony (in front of boards or the Assembly) as proof that one group or region is more put-upon than another. It will be used in testimony as evidence of a causal link between someone's health problems and the presence of, say, a power plant nearby. And this use will not be questioned.
This map, this rating, will be used without question as the rationale behind legislation. It will be used, and, again you see this in screenshot 6, to parse groups into those that get money vs. those that don't.
The only counter to things like this is to inform yourself, remembering to be careful to note the boundaries on what a measurement is and is not, and speak up about same.
https://cdphe.colorado.gov/enviroscreen
https://www.epa.gov/environmentaljustice
https://leg.colorado.gov/bills/hb21-1266
.
A quick vocab lesson
The below is a quick vocab lesson based on some research I had to do on something a reader sent. None of this is related directly to something we're all urgently discussing in Colorado right now; I want you to look on this as general information that I think would help make you (and me) more conversant in the issues of the day and better able to understand/join the discussion.
There were three terms that were new enough, and important enough, to share. They are carbon leakage, trade intensity, and energy intensity. I went out and did some reading and came back with some links from what I would term informed and reliable sources. I also chose them with a mind toward making it such that you could not accuse me of picking sources that were biased AGAINST climate change and thus twisting terms to their own ends.
Carbon leakage: the reference link is first below. The plain language definition is that carbon leakage are greenhouse gas emissions that happen DESPITE attempts to cut down on it. A couple of ways this can happen is if one political entity (in an attempt to reduce emissions) clamps down and the carbon-generating activity moves elsewhere (another country, another state, etc.). The other way that this can happen is if, in the faraway future, the United States' demand for oil drops enough to lower prices to where developing countries can and do consume more.
Trade Intensity: the reference link is second below. The definition in that link is pretty technical, but a good way to view it (from what I have seen on other sites) is that it's a measure of how enmeshed a particular economy is into the world economy. This also hints at the fact that trade intensity can tell you how sensitive something is to changes in the world economy. What I got from the reader was in the context of oil, so I think it's also fair to say that a discussion of trade intensity with regard to oil or gas would give a rough idea of how sensitive we are to world oil/gas market dynamics. If the nation's (or Colorado's) trade intensity index is a big number, we are importing or exporting a lot of oil relative to the size of our economy and price swings on the market will have a big effect.
Energy Intensity: the reference link is third below. The best/most intuitive explanation of this concept I found in looking was that energy efficiency and energy intensity are reciprocals. Energy efficiency tells you how much you got out of a process vs. how much energy went into it. For example, if your car can produce 20 units of kinetic (motion) energy from 100 units of fuel combustion energy, your car is 20% efficient. The energy intensity in this case would be to say that it takes 5 units of fuel combustion energy for every 1 unit of motion energy (because 100/20 = 5/1). A natural question with this is why have two?
That relates to what it is that you're measuring. Efficiency, when you scale up to large measurements across several different things, can hide a lot of detail and energy intensity (if you're going to confine yourself to assessing things in terms of single measurements) doesn't.
In the context of the material I was sent, let's say that you looked up how many goods and services we produced in this country vs. how much energy we consumed. If I told you that we made (keeping numbers simple), moved, sold, etc. $100 worth of goods for every megawatt-hour of energy in the entire economy I've told you an efficiency. I told you how much we got out vs. how much we put in.
Unfortunately, the efficiency doesn't tell you much about how good our economy is about using energy. It also doesn't tell you much about how this changes if we were to try and electrify. You don't know and can't use this number to make projections about how our economy would change if we moved heavy trucks to use energy of the grid or how many solar panels we'd need (vs. how much that costs) to replace coal in our nation.
If I instead told you that it took 1 megawatt-hour of energy to net $100 of value in our economy, that's an energy intensity and it's going to give you a better handle on the questions above.
I hope that was helpful. If nothing else, I hope you end the day knowing more than you started with.
https://archive.ipcc.ch/publications_and_data/ar4/wg3/en/ch11s11-7-2.html
https://wits.worldbank.org/wits/wits/witshelp/Content/Utilities/e1.trade_indicators.htm#:~:text=The%20trade%20intensity%20index%20(T,their%20importance%20in%20world%20trade.
https://www.energy.gov/eere/analysis/energy-efficiency-vs-energy-intensity
An update to the oil and gas bill I posted on...
The ill-conceived oil and gas bill I posted about a little ways back is continuing its journey through the House (as of the writing of the article below--at this point in the session things move quickly!).
It's getting a lot of amendments and a lot of attention as well it should. There are multiple problems with this bill--one of which being the fact that (and I believe I will separate this out as another post for later) things like oil and gas are heavily regulated by multiple agencies and state policymakers do not consider the scope and cumulative impact of their pet regulations in the context of others.
More details in the article below.
https://tsscolorado.com/air-pollution-bill-pared-back-a-second-time-but-major-opposition-remains/